What Is a Good Engagement Rate on LinkedIn? (2026)
A good LinkedIn engagement rate is hard to pin to one number. Here is the real formula, why the benchmarks mislead, and the metric that matters.

Search "what is a good engagement rate on LinkedIn" and you will get a dozen confident, contradictory numbers. Two percent. Five percent. Seven. Each one presented as the benchmark, none of them agreeing.
There is a reason for that, and it is worth understanding before you chase any of those numbers.
Engagement rate on LinkedIn is the share of the people who saw your post who then reacted, commented, or reposted it: reactions plus comments plus reposts, divided by impressions. The trouble is not the formula. The trouble is what counts as "good," and where those benchmark numbers come from.
How to calculate your LinkedIn engagement rate
The standard formula is simple:
Engagement rate = (reactions + comments + reposts) / impressions × 100
The one thing that matters here is the denominator. Use impressions, the number of times your post was actually seen, not your follower count. Follower-based math looks flattering, but it assumes every follower saw the post, and the feed never delivers anywhere close to that. A post shown to 800 of your 10,000 followers is a very different story depending on which number you divide by.
If you would rather not do the arithmetic by hand, the free engagement rate calculator runs it against your own numbers in a couple of minutes.
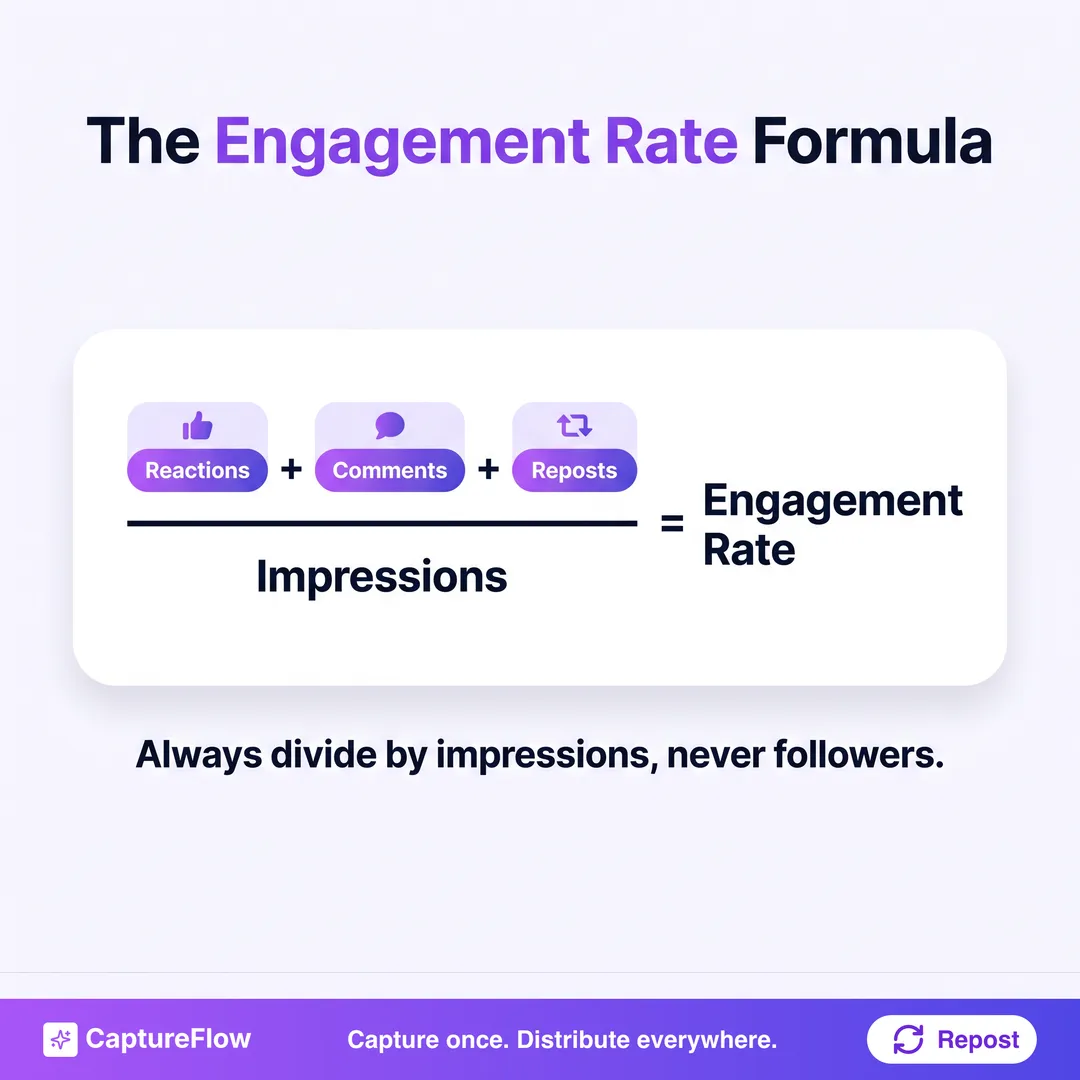 Reactions plus comments plus reposts, over impressions. Not followers.
So what is a good engagement rate?
Here is the honest answer: be suspicious of any exact number. As a rough working benchmark, engagement rates in the low single digits by impressions are typical, and anything consistently above that is strong. But treat that as a loose guide, not a target, for three reasons.
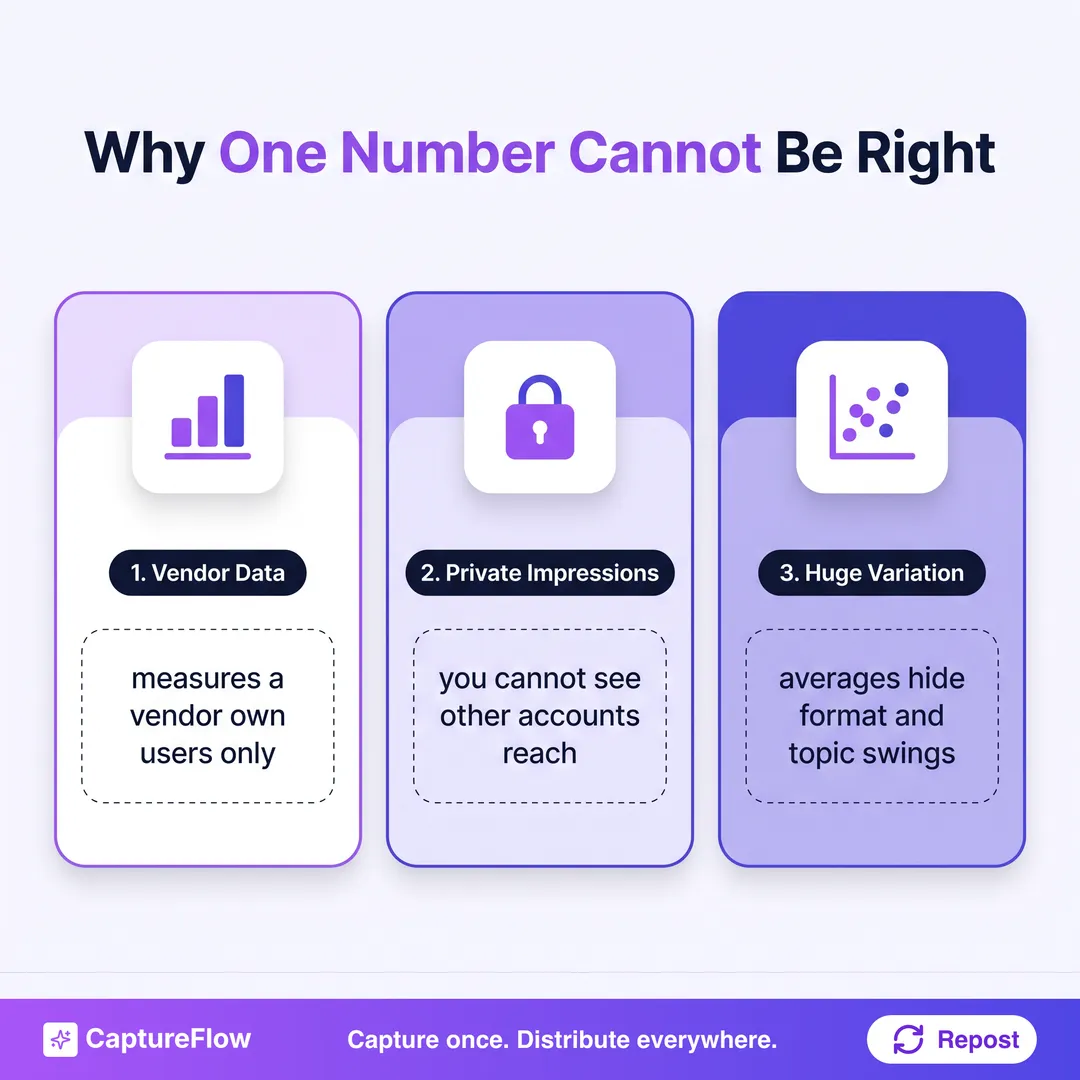 Why one universal "good" number does not exist.
The numbers come from tools measuring their own customers. Almost every widely-quoted LinkedIn benchmark is published by a social analytics or scheduling vendor, calculated across the accounts that use that vendor. That is a self-selected slice of LinkedIn, not the platform, and it is not your account.
Impressions are private. You can see your own impressions, but you cannot see anyone else's, so cross-account "average engagement rate" comparisons are built on numbers nobody outside those accounts can verify. You are comparing your real rate to an estimate of an estimate.
Averages hide enormous variation. Engagement rate swings wildly with follower count, format, topic, and posting cadence. A single blended average flattens all of that into a number that describes almost no real account well.
So chasing a benchmark is mostly a distraction. Your own rate, tracked over time on your own content strategy, tells you far more than any industry average.
A better number to track: engagement depth
If a single engagement rate is shaky, what should you watch instead? Engagement depth, the share of your engagement that is a comment rather than a passive like.
This is the number worth owning, and it is one we can actually measure. In our study of 2,500 posts from 25 founders, the median comment-to-reaction ratio was 20.9 percent, well above the low single digits typical of an average post. Every founder in the study beat that norm, because they write with a point of view that earns a comment instead of a scroll-past like.
The most striking finding: depth does not track follower count. The smallest accounts in our study consistently ran the deepest conversations, while the largest accounts pulled the most raw reactions and a shallower share of comments. Depth is a choice in how you write, not a prize you unlock by getting big.
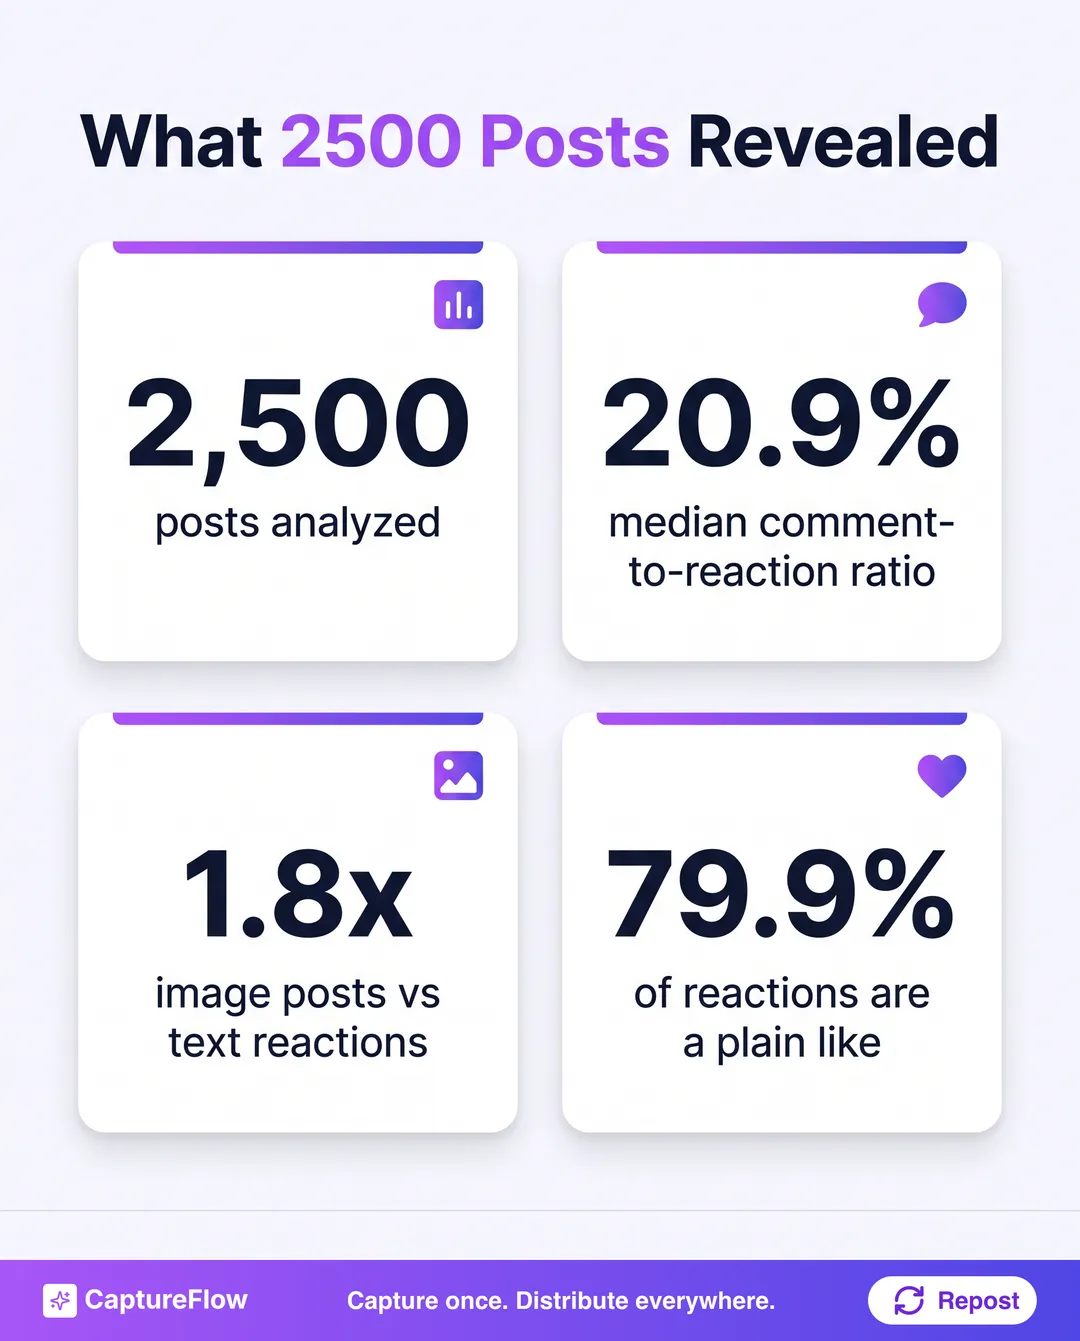 What 2,500 founder posts actually showed about LinkedIn engagement.
Raw engagement rate rewards the easy win: a pile of one-tap likes. Comment depth rewards the hard, valuable thing: people who cared enough to type. If you optimize one number on LinkedIn, make it depth.
What actually drives the engagement in the first place
Chasing a benchmark also skips the more useful question: what makes the feed show your post to more people at all?
LinkedIn has been unusually clear here. Its engineering team has said that dwell time, how long people actually spend on your post, is an explicit ranking signal, and that it captures the passive majority who read without ever tapping like. A post that holds attention outperforms one that gets a quick reaction and a scroll. This is the same machinery behind how the LinkedIn algorithm works.
Format matters too. In our study, image posts averaged 1.8x the reactions of text-only posts, and 79.9 percent of all reactions were still a plain Like, a reminder that most engagement is low-effort and comments are the rarer, sharper signal.
That is also where an AI content agent earns its place. CaptureFlow is an AI content agent that turns your expertise into weeks of on-brand content for every platform, which means it produces the native formats, the carousels, quote images, and short video, that hold attention and earn depth, rather than another wall of plain text.
The move
Stop hunting for the magic engagement rate. Calculate your own with the free calculator, watch your trend rather than an industry average, and optimize for comment depth over raw likes. That is the number that actually reflects an audience worth having, and unlike the benchmarks, it is one you can measure honestly.
Consistency is what compounds it. If showing up every week is the bottleneck, that is exactly the problem CaptureFlow is built to remove.
Sources
- HubSpot, Understand social media terms and metrics (engagement rate formula).
- LinkedIn Engineering, Understanding feed dwell time.
- CaptureFlow, What Drives LinkedIn Engagement: 2,500 Posts Analyzed.
Frequently asked questions
What is a good engagement rate on LinkedIn in 2026?+
There is no single reliable number, because engagement rate depends on impressions that are private to each account and the public benchmarks come from vendor tools measuring their own users. As a rough guide, low single digits by impressions is typical and anything consistently above that is strong, but tracking your own trend over time matters far more than hitting a benchmark.
How do I calculate my LinkedIn engagement rate?+
Add up reactions, comments, and reposts on a post, then divide by its impressions and multiply by 100. Use impressions, not follower count, as the denominator: your followers are not the same as the people who actually saw the post. A free calculator can do the math for you.
Is engagement rate the best metric to track on LinkedIn?+
Not on its own. Raw engagement rate rewards passive likes. A better signal of a healthy audience is engagement depth, the share of your engagement that is a comment rather than a like, because comments are what the feed rewards and what real conversation looks like.
Chris is the founder and CEO of CaptureFlow, which he builds so founders can turn their expertise into content without hiring a team. After 10+ years building products and growing audiences from scratch, he writes about founder-led content, AI, and distribution from inside the problem he is solving: distributing consistent, on-brand content as a team of one.
Founder & CEO of CaptureFlow · 10+ years building products and audiences
One playbook a week from founders who actually create and distribute lots of content. No spam, unsubscribe anytime.
Keep reading
LinkedIn Marketing for B2B Companies
For B2B, LinkedIn is not one channel among many. It is the channel. Here is how B2B companies actually win on it: the stack, the pillars, and the cadence.
How to Turn Meeting Recordings Into Content
Your best ideas get said out loud in meetings, then vanish. Here is how to turn a single recording into a week of social posts, in about 5 minutes.
Content Operations for B2B Teams: Build a Scalable System
More content is demanded than any B2B team can produce, so the work fragments across five tools and quality slips. Content operations is the fix. Here is the system.