What Drives LinkedIn Engagement: 2,500 Posts Analyzed
Our analysis of 2,500 LinkedIn posts from 25 founders: engagement depth does not track follower count. Small accounts win deeper conversation.


We built CaptureFlow's playbooks by pulling the public LinkedIn history of 25 founders and reading every post like a researcher, not a fan. By the time we were done we had analyzed 2,500 posts, and a pattern showed up that we were not expecting going in: what drives LinkedIn engagement is not who has the biggest audience. It is who earns the deepest conversation. This is the data behind that finding.
What we analyzed
The dataset spans 2,500 public LinkedIn posts from 25 founders, operators, and creators, with follower counts ranging from Arnaud Belinga's 22,861 up to the largest account in the study at 5.97 million. It is a deliberately wide range: bootstrapped operators like Diandra Escobar and Ross Simmonds sit in the same dataset as media-scale accounts like Steven Bartlett and investors like Codie Sanchez. For each founder we measured reactions, comments, posting cadence, and media mix (text, image, or video) across their full public history, the same raw material behind each individual playbook teardown.
Comment-to-reaction ratio is the percentage of a post's total engagement that is a comment rather than a passive reaction, and it is the clearest single measure of how deep an audience's engagement actually runs. A reaction takes one tap. A comment takes a thought. When we sorted the dataset by that ratio instead of by raw numbers, the leaderboard rearranged itself completely.
What actually drives LinkedIn engagement
Here is the finding this whole piece is built around: engagement depth does not track follower count. The founders with the highest comment-to-reaction ratios in our analysis of 2,500 posts are not the founders with the most followers. They are, if anything, the opposite. The accounts with the smallest audiences in the study consistently ran the deepest conversations, while the largest accounts pulled in the most raw reactions and a comparatively shallower share of comments.
That is a genuinely useful thing to know if you are trying to figure out what drives LinkedIn engagement for your own account, because it means depth is not a prize that shows up automatically once you get big enough. It is closer to a choice you make in how you write and how you show up in your own comments, and small accounts can out-earn big ones on it starting from post one.
Reach and depth are two different games on LinkedIn, and our data suggests they are won by different accounts. A big following buys you a bigger initial audience for a post. It does not buy you a comment section people actually want to be in.
The comment-to-reaction ratio, explained
Across all 2,500 posts, the median comment-to-reaction ratio was 20.9 percent and the mean was 28.8 percent, pulled higher by a handful of founders running exceptionally deep threads. Every one of the 25 founders in the study beat what tends to be cited as a typical range for a LinkedIn post, usually somewhere in the low single digits. That is not a coincidence: all 25 accounts in our dataset are founders who treat LinkedIn as a primary channel and write with a deliberate point of view, which is exactly the kind of content that earns a comment instead of a scroll-past like.
The range inside the study was wide. Anton Osika sat at the low end with a 6.2 percent ratio, close to that typical baseline. Nicolas Cole sat at the opposite extreme with a 97.6 percent ratio, meaning almost every reaction his posts earned arrived alongside a comment. That is a 91-point spread between two founders on the same platform, writing to different-sized audiences, using the same distribution mechanics.
The pattern in the dataDepth is a choice, not a byproduct of reach.
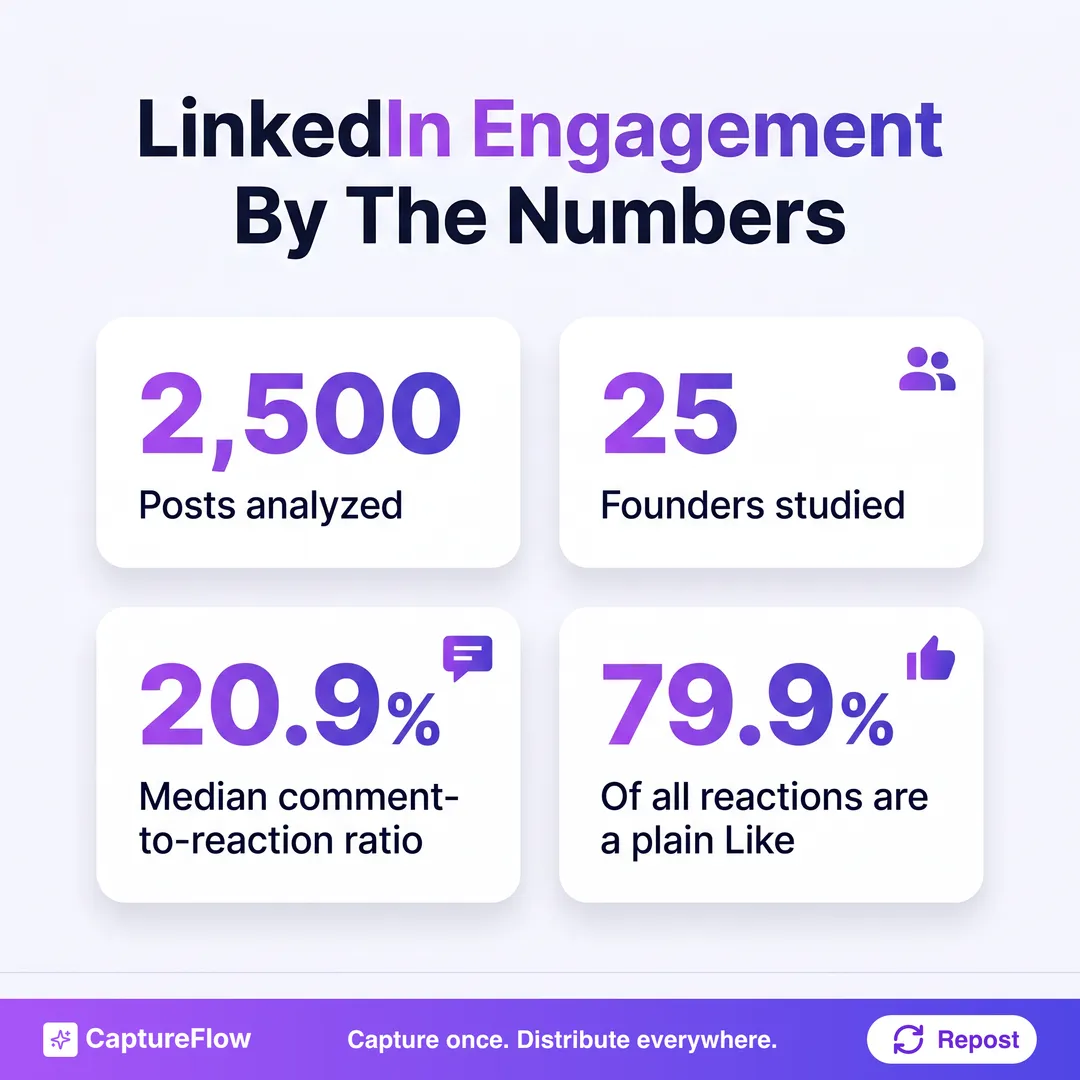 The study in four numbers, from our analysis of 25 founders' public LinkedIn history.
The founders with the deepest conversations
Ranked purely by comment-to-reaction ratio, the top of the leaderboard looks nothing like a follower-count leaderboard would. Nicolas Cole leads at 97.6 percent, followed by Chris Donnelly at 61 percent, Diandra Escobar at 56.2 percent, Arnaud Belinga at 55.6 percent, and Katelyn Bourgoin rounding out the top five at 48.5 percent.
What stands out is who is missing from that list: the accounts with the largest reach in the study. Arnaud Belinga's 22,861 followers make him the smallest account we analyzed, and he still landed fourth on comment depth. Diandra Escobar's audience is similarly modest by the standards of this dataset. Both out-earned founders with audiences ten and a hundred times their size on the one metric that measures whether people actually stop to respond.
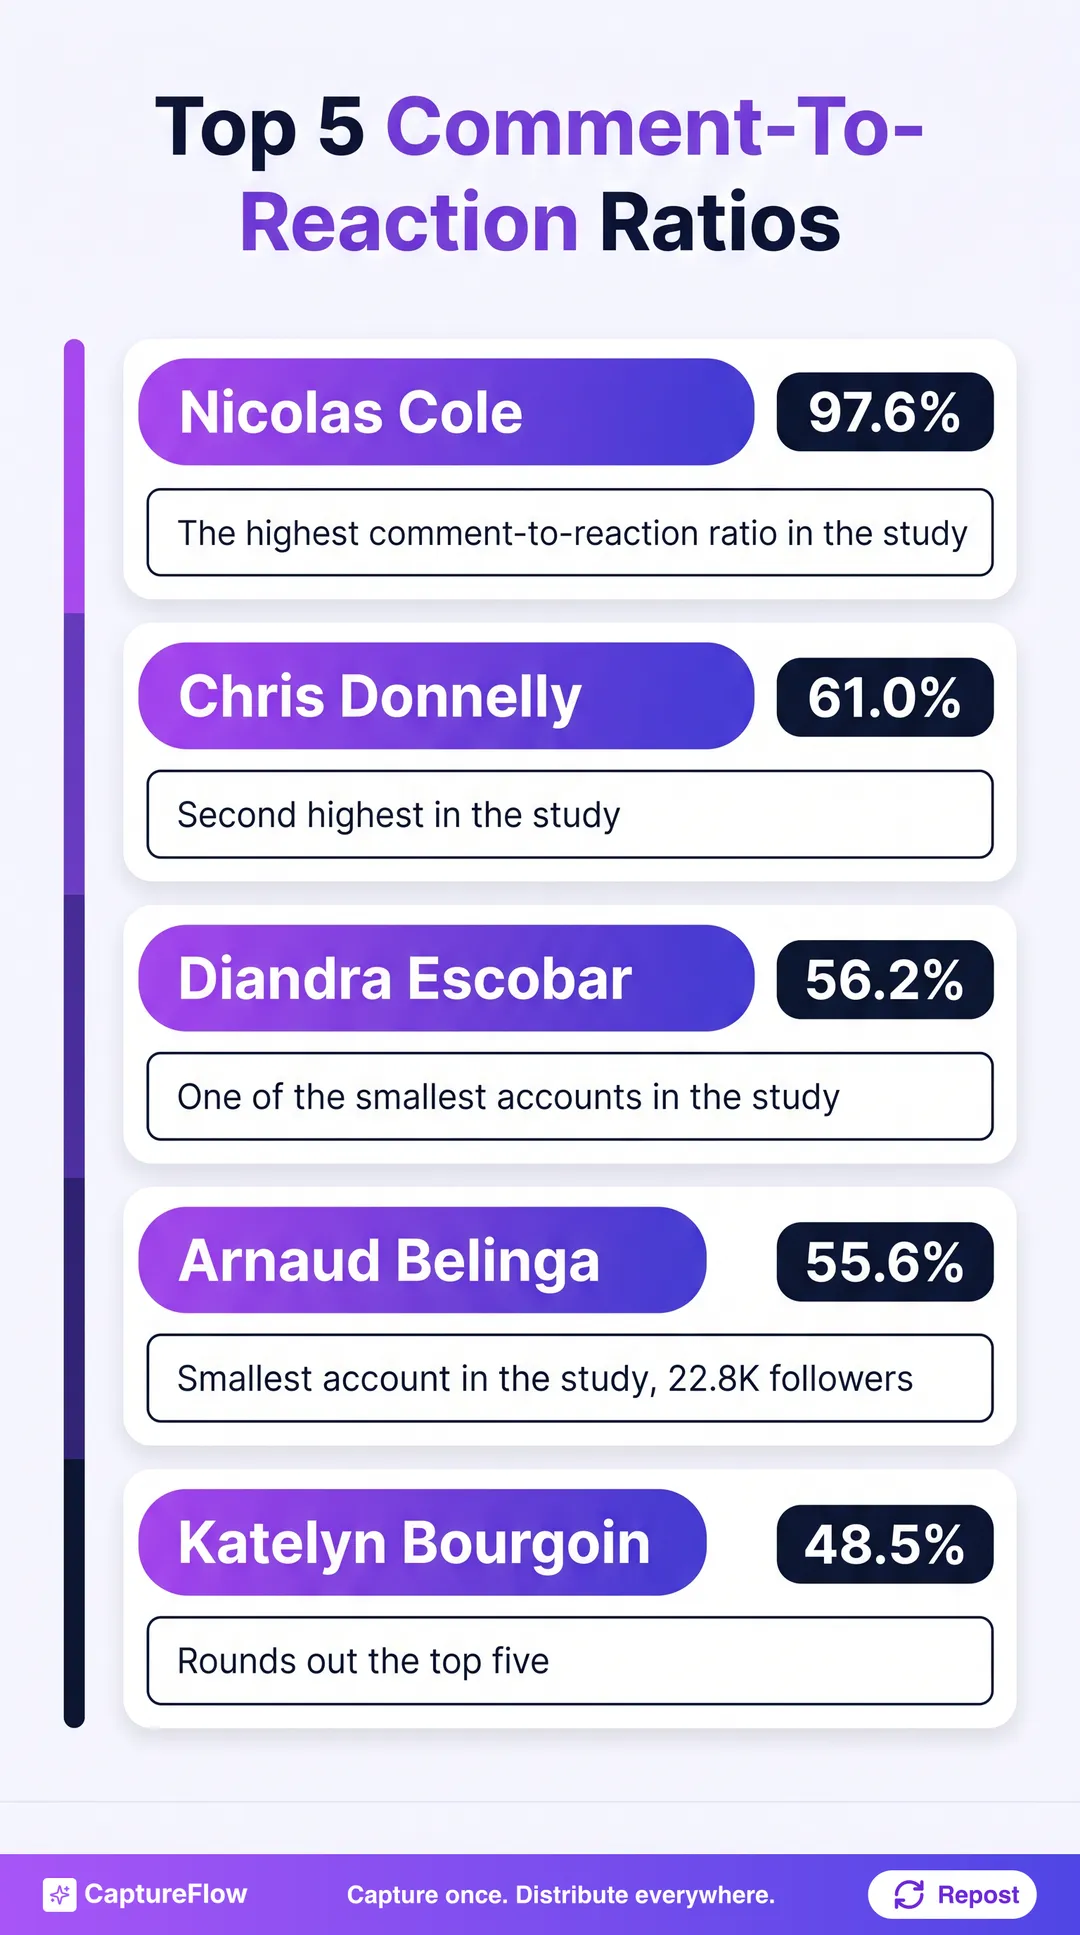 The five deepest comment-to-reaction ratios in our analysis of 2,500 posts.
Reach vs depth: why the biggest accounts play a different game
The flip side of that leaderboard is just as telling. Steven Bartlett posts to the largest audience in our dataset and pulls the highest average reactions per post at 6,338, comfortably ahead of Justin Welsh at 3,981 and Sahil Bloom at 2,163. Those are the accounts winning the reach game by a wide margin. But raw reactions and comment depth are not the same contest, and our data shows mega accounts trading one for the other: as an account's reach grows, its comment-to-reaction ratio tends to compress, even as its total reaction count climbs into the thousands.
Meanwhile the founders with the lowest average reactions per post, Arnaud Belinga at 36, Ross Simmonds at 81, and Nicolas Cole at 127, are not underperforming. They are simply optimized for a different outcome. Nicolas Cole in particular is proof this is not a tradeoff you are stuck with: he has both one of the lowest average reaction counts in the study and its single highest comment-to-reaction ratio. Low reach, extremely high depth, on purpose.
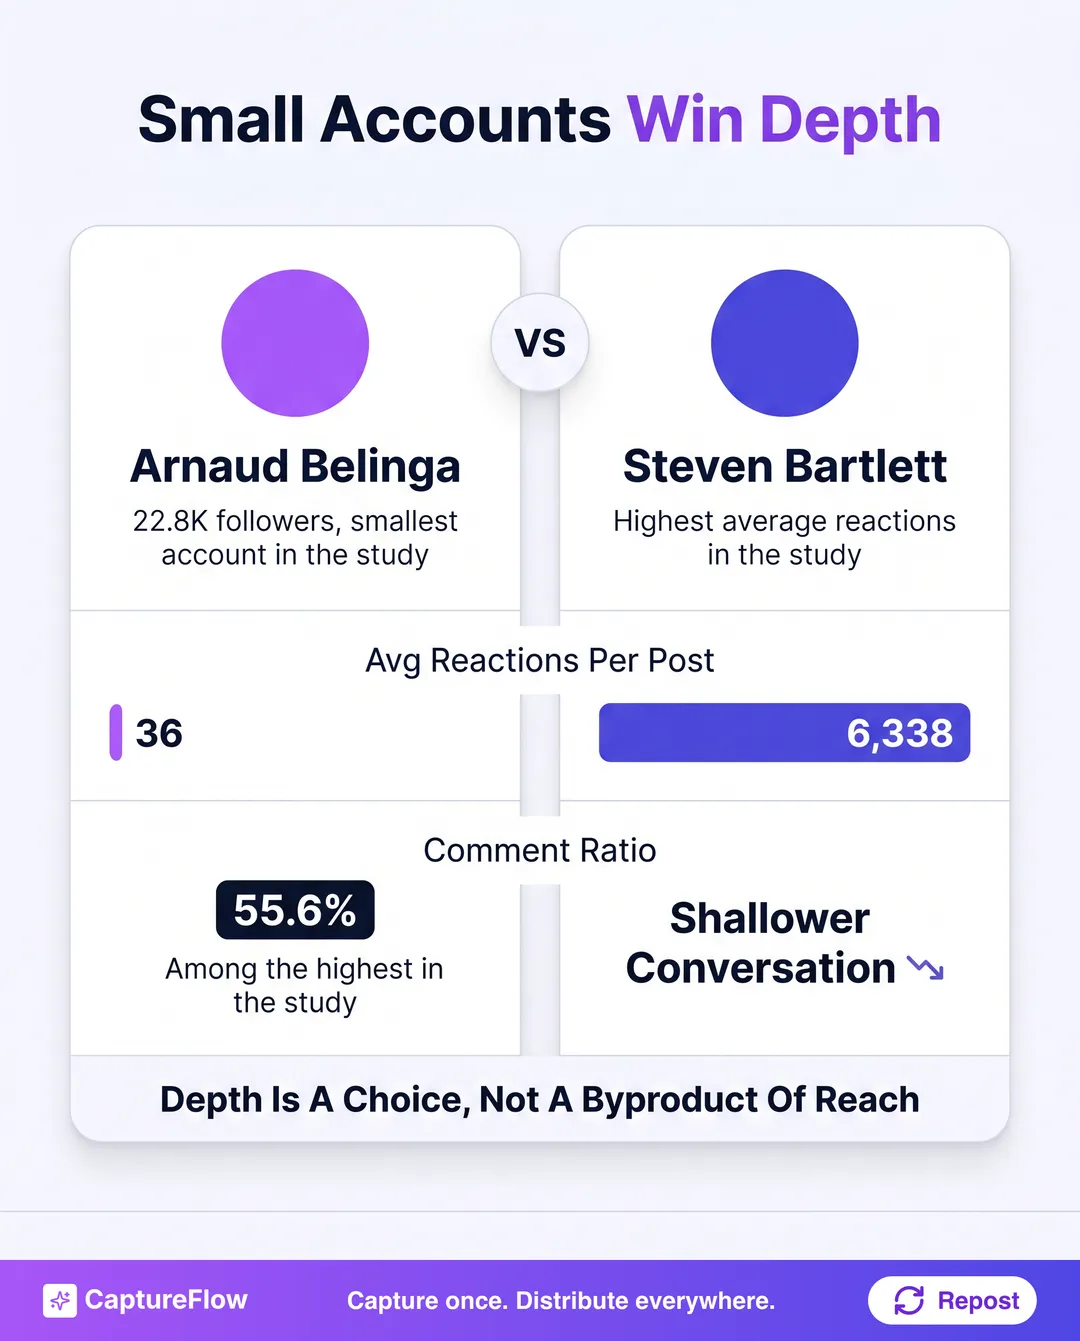 Reach and depth pull in different directions. Steven Bartlett wins raw reactions; Arnaud Belinga wins conversation.
If you want a read on where your own account sits on that spectrum, the free engagement rate calculator will do the math against your own numbers in a couple of minutes, and our guide to what counts as a good engagement rate explains how to read the result.
Posting cadence: more isn't automatically better
Posting frequency across the 25 founders ranged from 1.1 to 85.5 posts a week, with a median of 5.7 and a mean of 9.1, the mean pulled well above the median by a single outlier posting more than 12 times a day. That spread alone tells you cadence is not a single dial every serious LinkedIn account turns to the same setting.
More importantly for what drives LinkedIn engagement, cadence and comment depth do not move together in any consistent direction in our data. Some of the founders with the deepest comment-to-reaction ratios post well below the study's median frequency, which argues against the idea that flooding the feed is what earns a real audience. Showing up on a schedule you can sustain, in a content strategy built for your voice, matters more than hitting a specific weekly number. Best time to post on LinkedIn covers the timing side of that same question.
What format wins: images beat text by 1.8x
Media mix was the clearest structural pattern in the dataset. Fourteen of the 25 founders were image-dominant, seven were text-dominant, and 23 of the 25 used video at least occasionally somewhere in their history. Across the full dataset, image posts averaged 1.8x the reactions of text-only posts.
That does not mean text posts are a mistake. Several of the founders with the deepest comment ratios, including Nicolas Cole, lean heavily on plain text. It does mean that if raw reach is the goal, a well-chosen image is the single easiest lever in the dataset, and it is one reason carousels and static graphics show up so often in high-performing founder feeds.
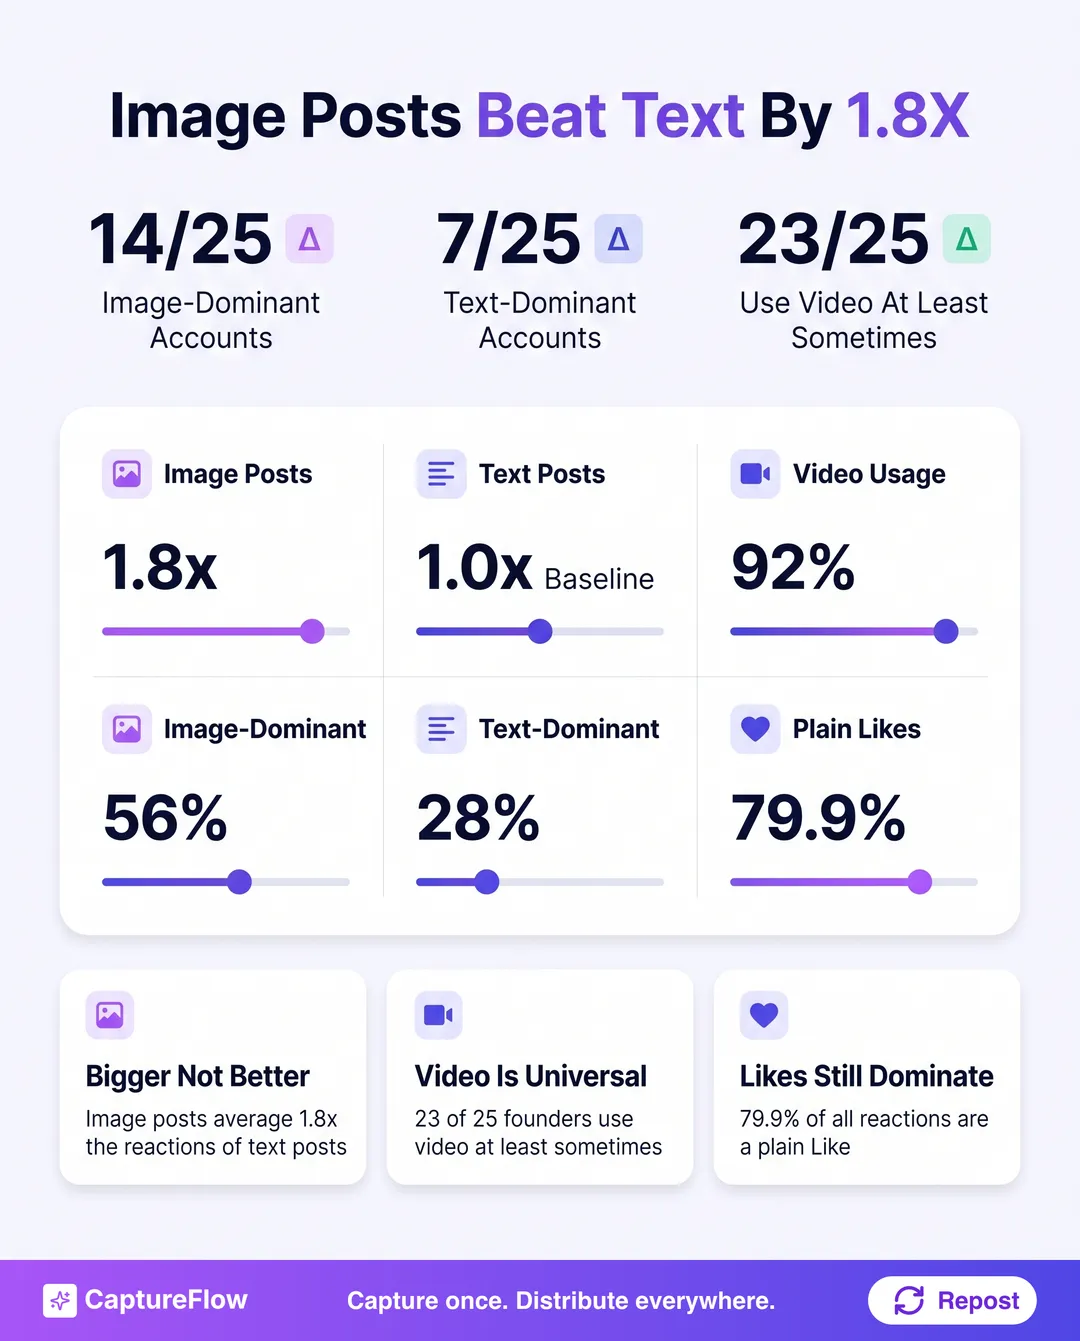 Image posts out-react text posts by 1.8x, but media mix alone does not explain comment depth.
The like is still king
For all the attention comment ratios deserve, it is worth being honest about where the bulk of engagement actually lands: 79.9 percent of all reactions across the 2,500 posts we analyzed were a plain Like, the simplest, lowest-effort reaction LinkedIn offers. The remaining fifth splits across Celebrate, Support, Love, Insightful, and Funny. Comments are the sharpest signal of depth, but they are still a minority of total engagement even on the accounts that earn the most of them. That is precisely why the comment-to-reaction ratio, rather than raw reaction counts, is the number worth tracking if depth is what you are optimizing for.
How to use this data on your own LinkedIn strategy
Three things fall out of this dataset if you are building your own presence rather than someone else's. First, do not wait for a bigger audience to start earning real conversation. The data says the opposite tends to happen: the smallest accounts in our study ran the deepest comment sections. Second, treat cadence as a sustainability question, not a growth hack. A schedule you can hold matters more than a specific weekly number, and it is worth reading the mechanics behind that in how the LinkedIn algorithm works. Third, the hook still does the heaviest lifting for whether a post earns a comment at all; our guide to writing LinkedIn hooks is the natural next read, and the free LinkedIn analyzer will score a draft against the patterns we found across all 25 founders before you publish it.
This is also, unsurprisingly, the exact problem CaptureFlow exists to solve. CaptureFlow is an AI content agent that turns your expertise into weeks of on-brand content for every platform. You capture one idea in 5 minutes, a voice note, a video, a file, or a link, and it reshapes that into native LinkedIn posts trained on your own voice and past posts, so a deep comment section is not something that only happens when you have time to write. If consistency is the gap between you and a comment-to-reaction ratio like the ones above, our features page walks through how that works, and pricing has the plans.
FAQ
See the questions above for direct answers on what drives engagement, what counts as a good comment-to-reaction ratio, and whether cadence matters.
Sources
- CaptureFlow original research: analysis of 2,500 public LinkedIn posts across 25 founder accounts, conducted for the CaptureFlow playbooks series.
- Individual founder data referenced throughout is drawn from the same dataset and detailed in each founder's playbook.
Frequently asked questions
What drives LinkedIn engagement the most?+
Depth, not reach. Our analysis of 2,500 posts found the comment-to-reaction ratio, the share of engagement that is a comment rather than a passive reaction, barely correlates with follower count. Consistency, native format, and a real point of view drive comments; follower count mostly drives raw reaction volume.
What is a good comment-to-reaction ratio on LinkedIn?+
In our study of 25 founders, the median comment-to-reaction ratio was 20.9 percent and the mean was 28.8 percent, both well above the low single digits typical of an average LinkedIn post. Anything above 15 to 20 percent signals a post is generating real conversation, not just passive scrolling engagement.
Does posting more often increase LinkedIn engagement?+
Not reliably. Posting cadence across our 25 founders ranged from 1.1 to 85.5 posts a week, with a median of 5.7 and a mean pulled up to 9.1 by one high-volume outlier. Some of the highest comment-to-reaction ratios in the study belong to founders posting well below the median, which suggests quality of engagement is not simply a function of volume.
Chris is the founder and CEO of CaptureFlow, which he builds so founders can turn their expertise into content without hiring a team. After 10+ years building products and growing audiences from scratch, he writes about founder-led content, AI, and distribution from inside the problem he is solving: distributing consistent, on-brand content as a team of one.
Founder & CEO of CaptureFlow · 10+ years building products and audiences
One playbook a week from founders who actually create and distribute lots of content. No spam, unsubscribe anytime.
Keep reading

LinkedIn Content Ideas: 50 Posts to Steal When You're Not an Influencer
You are not out of things to say, you are out of shapes to say them in. Here are 50 specific LinkedIn content ideas, organized into 6 buckets, that you can post starting today.

LinkedIn Content Strategy: The Complete 2026 Guide
Most founders post on LinkedIn at random and wonder why nothing compounds. This is the complete LinkedIn content strategy, from positioning to pillars to cadence to tooling.

How to Make a Scroll-Stopping LinkedIn Carousel in 2026
A LinkedIn carousel is the highest-dwell format in the feed. Here is how to make one that earns the swipe, from one idea to a finished PDF.