What Is a Good Engagement Rate on YouTube in 2026?
A good YouTube engagement rate is about 3 to 4% for long-form and 2.5 to 3% for Shorts, with 5%+ strong. Here is how to read yours and what to fix first.

You check a video a week after upload: 4,000 views, 110 likes, 18 comments. Is that good? Run the math and your YouTube engagement rate is 3.2%, which is right around typical for a long-form video in 2026. Roughly 3 to 4% is normal, about 5% is strong, and above 7% puts you in the top tenth of recent uploads.
But here's the catch. On YouTube, engagement rate is the least useful of the three numbers that decide whether a video grows. If you only stare at likes and comments, you'll fix the wrong thing.
YouTube engagement rate is the share of a video's viewers who like or comment on it: (likes + comments) ÷ views × 100.
This guide covers what a good number looks like for each of the three signals that matter, where the benchmarks come from (and how much to trust them), and which one to fix first.
Why is YouTube engagement different from other platforms?
On Instagram or LinkedIn you can mostly get away with one engagement percentage. Our guides on Instagram engagement rate and LinkedIn engagement rate both lean on a single number for that reason.
YouTube splits the job across three separate signals, and each one answers a different question:
- Click-through rate (CTR): did your title and thumbnail earn the click?
- Retention (average view duration): did the video deliver what the packaging promised?
- Engagement rate: did it move anyone enough to like or comment?
They fail independently. A video can pull an 8% CTR and lose half its audience in 30 seconds. Another can hold people for 70% of its runtime and get four comments. The fix for one does nothing for the other, which is why a single "engagement" score hides more than it shows.
YouTube's own account of its recommendation system lists clicks, watch time, user surveys, shares, likes, and dislikes as inputs. Likes and comments are in there. They're just not alone, and they're not first.
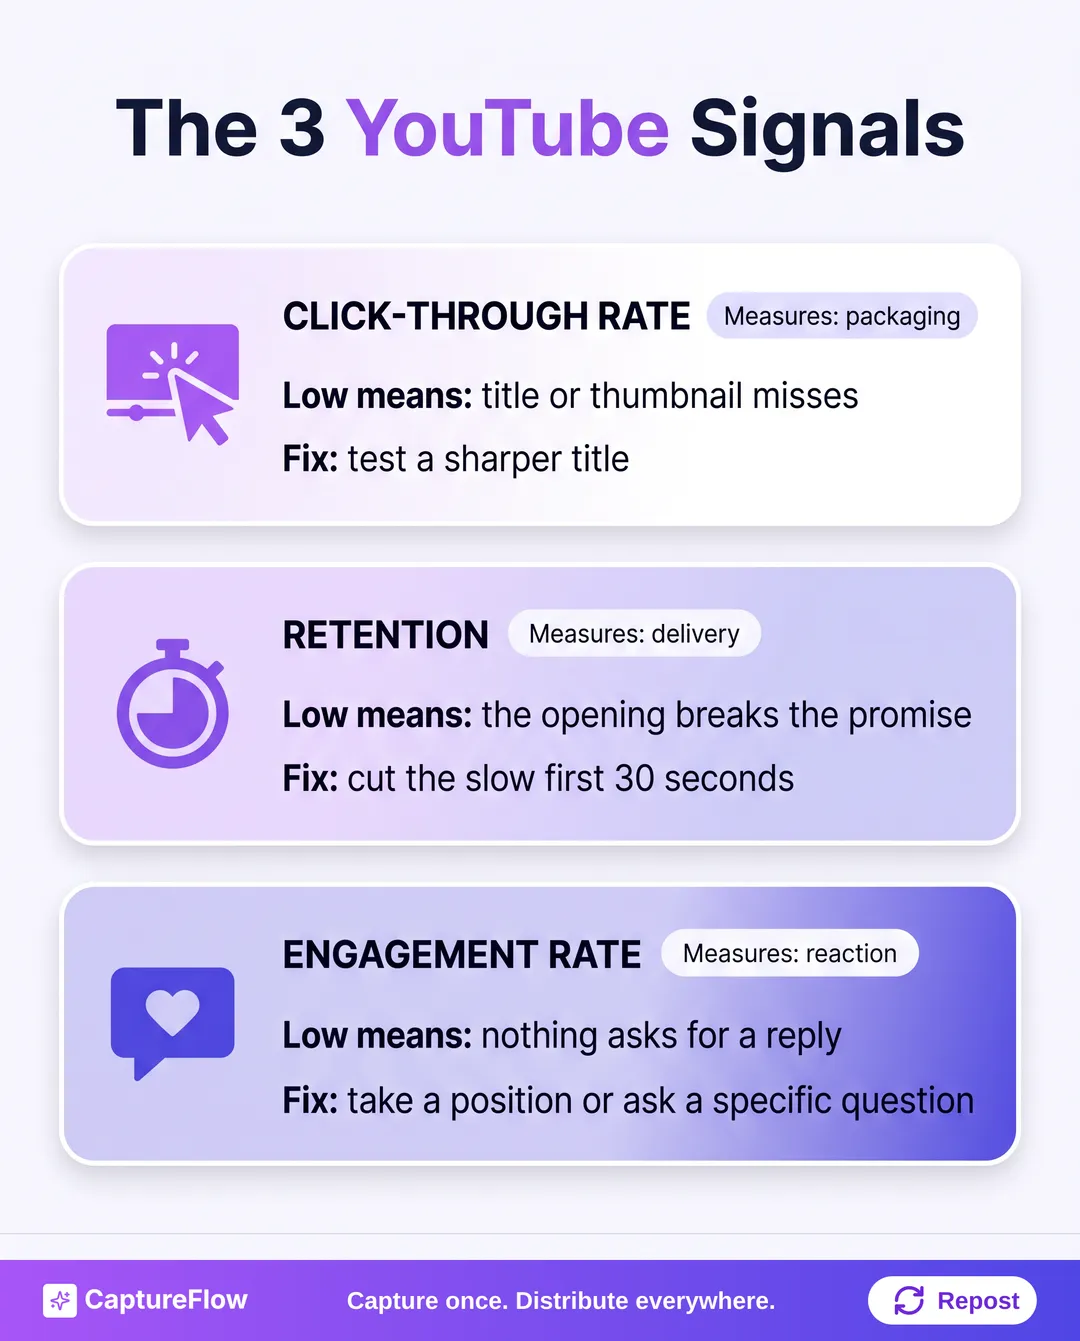 The three YouTube signals, what each one measures, and what a low number is telling you.
What is a good click-through rate on YouTube?
CTR is the share of impressions (your thumbnail shown on YouTube) that turned into a view. It's a packaging metric. It grades your title and thumbnail, not the video.
This is the one place YouTube gives you a first-party benchmark. According to the YouTube Help Center, "half of all channels and videos on YouTube have an impressions CTR that can range between 2% and 10%." That's it. Every niche-by-niche CTR table online is modeled from somebody's sample, because impression data never leaves your own Studio.
A practical way to read your number:
| Impressions CTR | What it usually means |
|---|---|
| Under 2% | Packaging problem. The title or thumbnail isn't earning the click. |
| 2% to 5% | Normal, especially if most impressions come from browse or suggested. |
| 5% to 10% | Strong. Your packaging is doing its job. |
| Over 10% | Exceptional, or most impressions come from people who already know you. |
That last caveat matters. YouTube notes that videos whose impressions come mostly from places like your channel page tend to show higher CTRs, and that brand new videos (under a week old, or under 100 views) swing wider. So a big channel at 3% can be perfectly healthy: it's being shown to a lot of strangers. A small channel at 9% might just be shown to its own subscribers.
If your CTR is low, the title is the cheapest lever to pull; you can change it in a minute and watch the trend. Our free YouTube title generator gives you a handful of angles to test.
What is a good average view duration?
Average view duration is how long the average view lasts. Studio also shows it as average percentage viewed, which is the more useful version because it normalizes for length.
Here's the honest bit: YouTube publishes no global retention benchmark. Instead, Studio compares each video to your own. The gray band on the retention chart is your "typical retention," defined in the YouTube Help Center as what your last 10 videos of similar length maintained. That's a better benchmark than any industry average, because it's your audience and your format.
One concrete threshold YouTube does mention: a video lands on the "above typical intros" list when at least 50% of viewers are still watching at the 30-second mark. Treat that as your first-30-seconds target.
What a low number tells you depends on CTR:
- Healthy CTR, poor retention: a promise problem. The packaging set an expectation the opening didn't meet. A new thumbnail won't fix it.
- Poor CTR, decent retention: the video is fine. Fewer people get to find that out.
Open the retention graph and find the first big dip. That exact second is the thing to fix, usually a slow intro, a long logo sting, or the payoff buried at minute six.
Shorts counting changed in 2025. Since March 31, 2025, YouTube counts a Shorts view every time a Short starts or replays, with no minimum watch time. The old metric survives as "engaged views" in Advanced Mode. More views with the same likes means a lower public engagement rate, so don't compare a 2026 Short against a 2024 one without accounting for it.
What is a good YouTube engagement rate in 2026?
Now the number this article is named after. The most useful recent dataset we found is an August 2026 analysis by OverseerOS of 2,251 public videos from 309 channels, each observed 7 to 30 days after upload, using (likes + comments) ÷ views. It's one analytics company's sample, not a random cut of YouTube, and they say so plainly. With that caveat, here's where recent videos landed:
| Percentile | Long-form | Shorts (3 min or less) |
|---|---|---|
| Bottom quarter (p25) | 2.22% | 1.14% |
| Median | 3.48% | 2.71% |
| Top quarter (p75) | 4.91% | 4.55% |
| Top 10% (p90) | 7.26% | 6.67% |
The shorthand: 3 to 4% is typical for long-form, around 5% is strong, and above 7% is rare air.
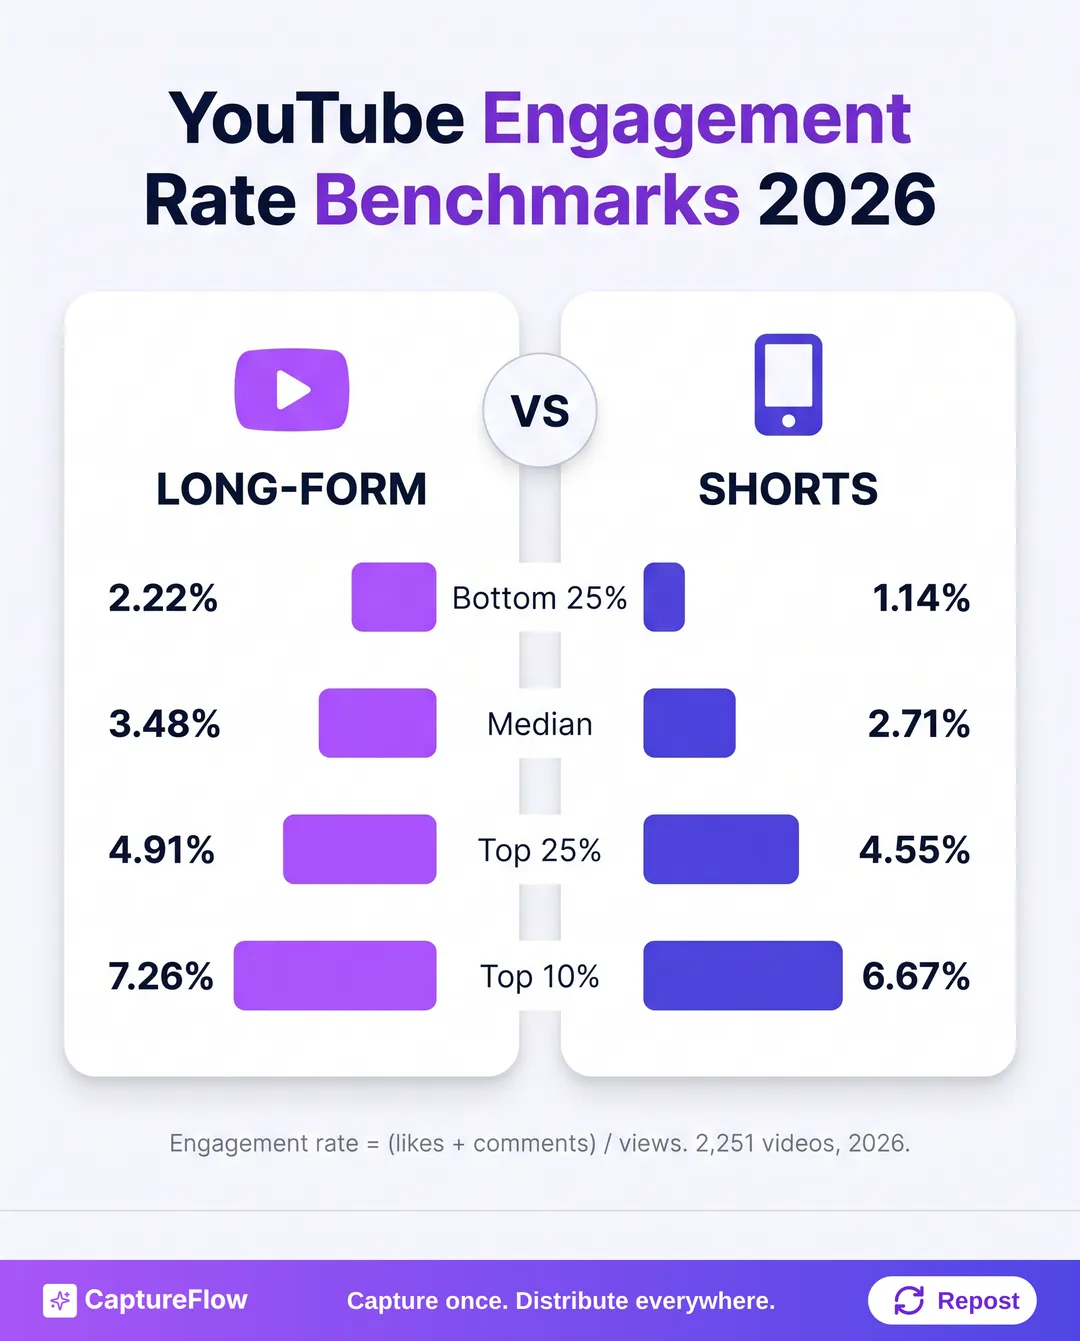 YouTube engagement rate percentiles for long-form and Shorts, from 2,251 recent videos.
Does channel size change what counts as good?
Less than you'd think. In the same dataset, median long-form engagement sat between 3.33% and 3.66% at every size band, from under 10K subscribers to over 1M. The correlation with subscriber count was close to zero (−0.058).
That's different from Instagram, where bigger accounts reliably get lower rates. On YouTube, people who click a video chose that video. Size doesn't protect you, and it doesn't hold you back.
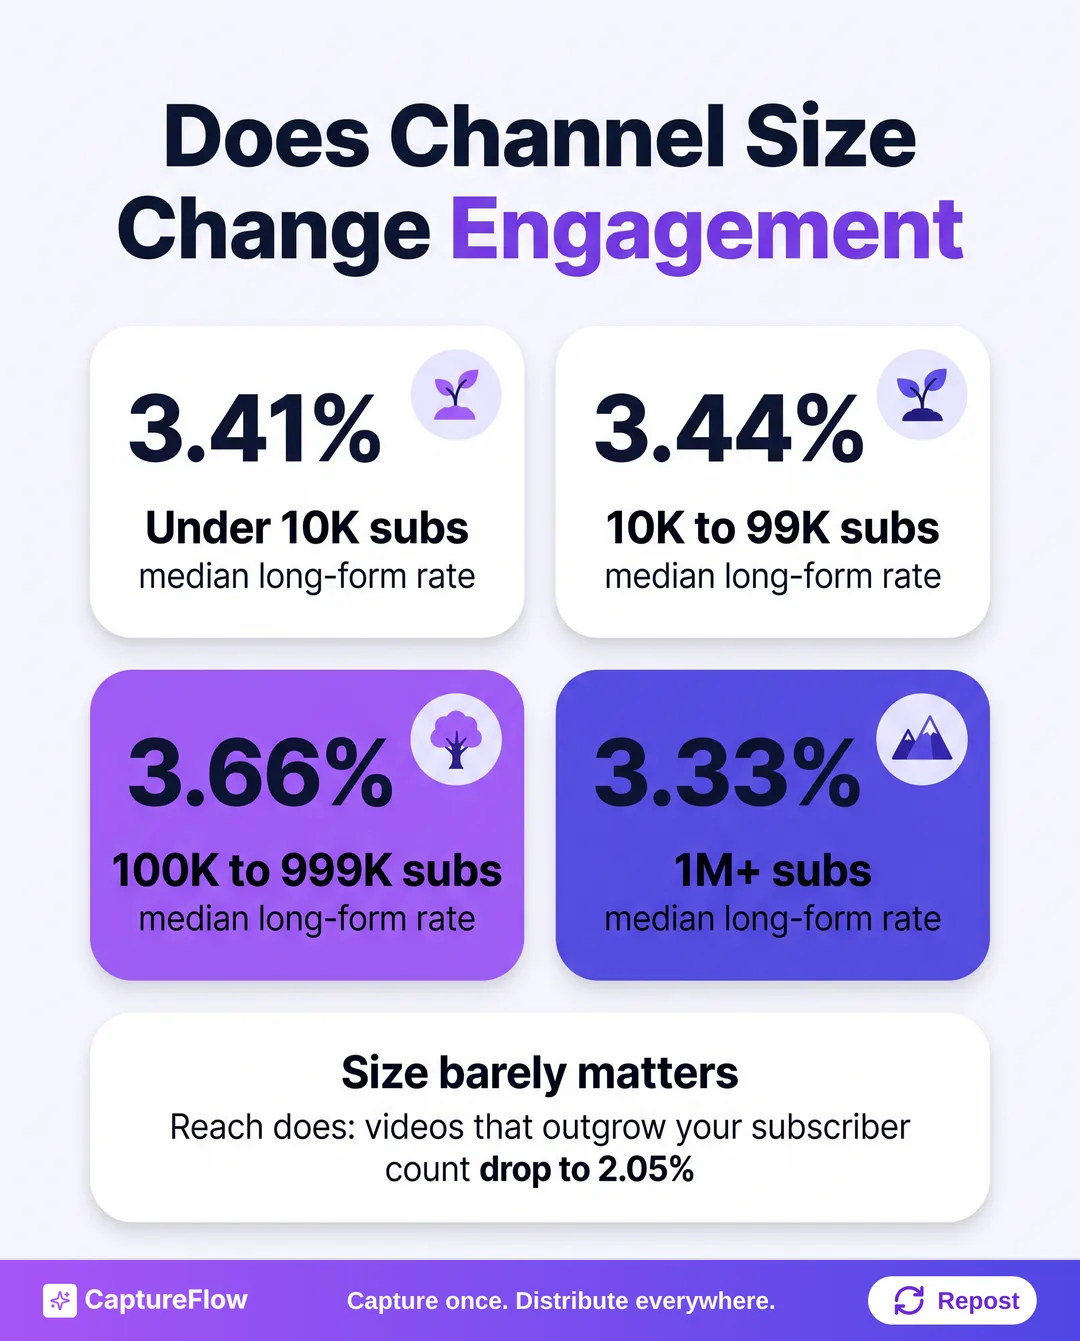 Median long-form engagement barely moves with subscriber count. Reach is what pulls it down.
What did move the number: reach. Long-form videos that pulled more views than the channel has subscribers had a median rate of 2.05%, against roughly 3.5% for videos that stayed closer to the existing audience. A video that breaks out to strangers will almost always show a lower engagement rate. That's not a failure. It's what reaching new people looks like.
A falling engagement rate on a video that's getting recommended to strangers is usually good news wearing a bad number.
Shorts vs long-form
Don't average them together. Shorts earn more likes per view and fewer comments per view than regular videos, a pattern a 2024 ACM Web Science study found across a large sample of channels. The 2026 numbers say the same thing: median comment rate was 0.238% for long-form and 0.032% for Shorts. Keep two separate averages.
What is a good comment-to-view ratio?
Comments are the hardest engagement to earn, so they're the clearest sign a video made someone think. In the OverseerOS sample, the long-form median was 0.238%, about 2.4 comments per 1,000 views, and the top quarter cleared 4.4 per 1,000.
| Comments per 1,000 views (long-form) | Read |
|---|---|
| Under 1 | Low. Nothing in the video asks for a reaction. |
| 1 to 3 | Around typical. |
| 3 to 5 | Strong. |
| Over 5 | Top 25% territory and above. People are arguing in your comments. |
"Leave a comment below" rarely fixes a low number. What works is building a reaction into the video: take a position someone can disagree with, make a prediction, or end on a specific question only a person who watched would have an opinion on. "Which of these three would you cut first?" beats "Thoughts?" every time.
One footnote: comment counts depend on your moderation settings, so a channel that holds lots of comments for review will read low.
Which YouTube metric should you fix first?
You can't fix all three at once, and you shouldn't try. Work top-down:
- CTR first. If nobody clicks, you have no retention data and no comments to measure. A video stuck at 1.5% CTR won't collect enough views to tell you anything else.
- Retention second. People click and leave, YouTube shows the video to fewer people. Fix the first 30 seconds and the promise gap.
- Engagement last. Likes and comments matter, but you can't prompt a reaction from viewers who left at 0:40.
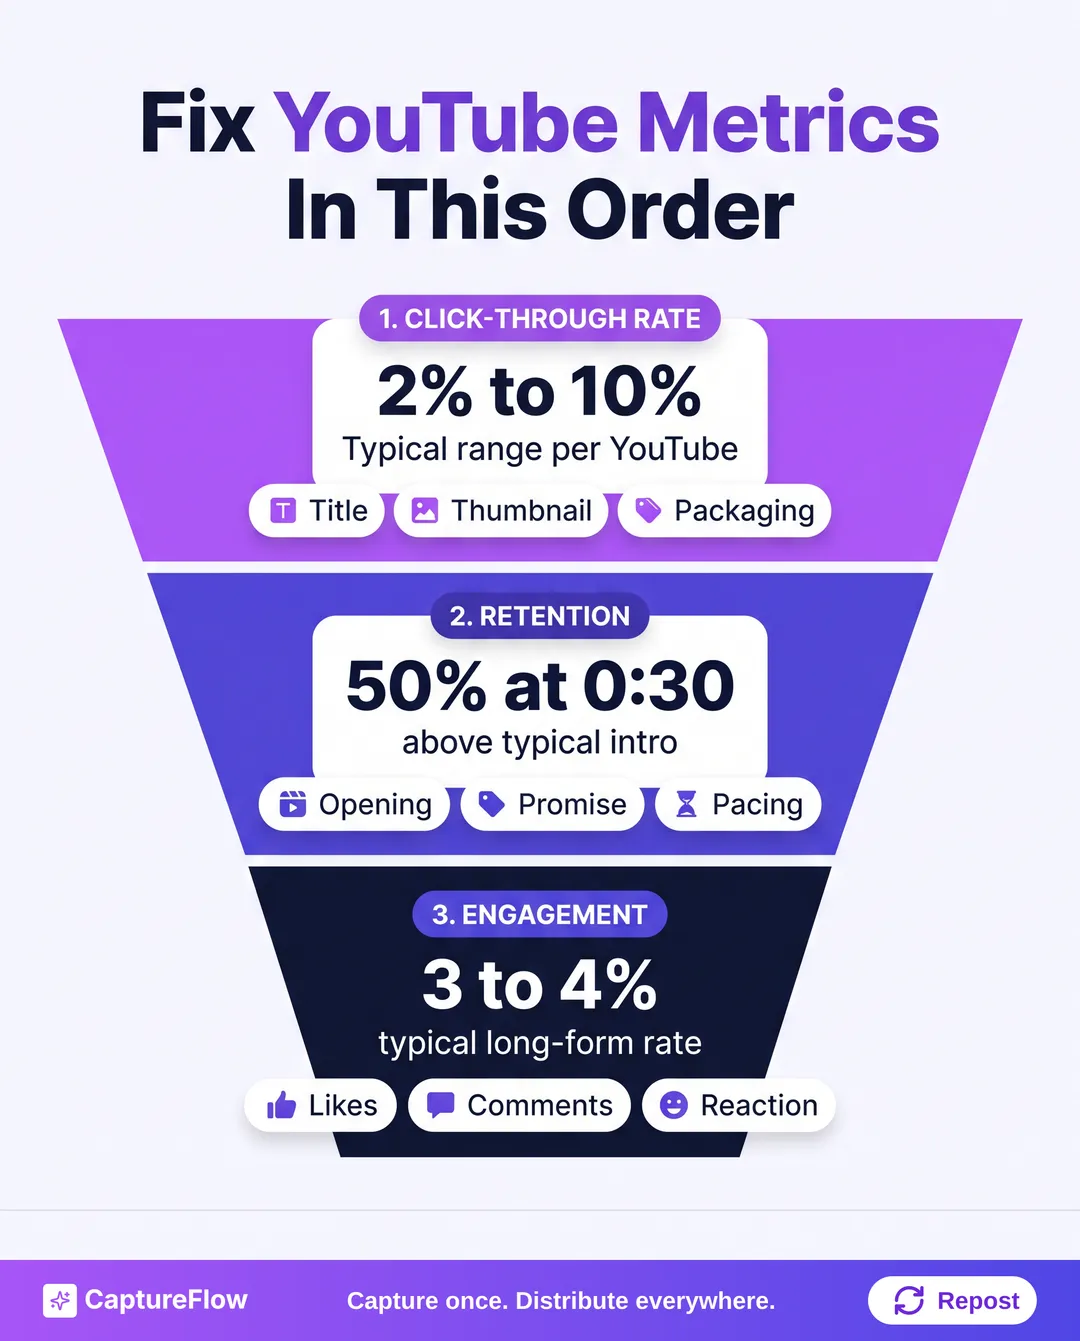 Fix YouTube metrics top-down: packaging, then delivery, then reaction.
How do you check your numbers in YouTube Studio?
- Open YouTube Studio, then Analytics, then the Content tab. Impressions, impressions CTR, views, and average view duration live there for your whole channel, split by format.
- Click into a single video's analytics to see its retention graph, the gray "typical" band, and key moments like spikes and dips.
- Pull likes, comments, and views for your last 10 to 20 uploads (long-form and Shorts separately) and calculate the engagement rate for each. Our engagement rate calculator does the arithmetic, and the engagement benchmarks tool gives a quick sense check by platform.
Ten videos is a pattern. One video is a mood.
Track your median across 10 to 20 uploads, not your best video. One breakout skews averages in both directions: it lowers the rate (strangers engage less) while it pumps up views. The median ignores that noise.
Why subscriber count tells you the least
Subscriber count is the number most creators check and the one that says least about how a channel is doing right now. It's a record of who opted in at some point. YouTube's recommendations are built around what each viewer is likely to watch and enjoy, so a subscription doesn't guarantee anyone sees your next upload.
A channel with 80,000 subscribers, a 1.8% CTR, and retention sliding under its typical band is in worse shape than an 800-subscriber channel at 7% CTR with an "above typical" intro. The second channel is earning clicks and keeping people. The first is living off the past.
The real constraint: enough videos to test against
Every fix above needs reps. You can't learn whether your new intro beats your old one from two uploads, and you can't find your typical retention band with three videos in the channel. Most founders and small teams stall on volume long before they stall on thumbnails.
That's the gap we built CaptureFlow for. CaptureFlow is an AI content agent that turns your expertise into weeks of on-brand content for every platform. You capture one idea in about 5 minutes (a voice note, a video, a file, or a link), and the agent, trained on your voice and past posts, reshapes it into native formats for each channel: short and long form video, carousels, infographics, quote images, and text posts for YouTube, LinkedIn, and X. If you already have a long video, our guides to repurposing a YouTube video and cutting one long video into Shorts show how far one recording goes.
More good videos means more data on what your audience actually clicks, watches, and argues about. See the plans when you're ready to stop guessing from three uploads.
Sources
- YouTube Help: Impressions and click-through rate FAQ
- YouTube Help: Measure key moments for audience retention
- YouTube Official Blog: On YouTube's recommendation system
- TechCrunch: YouTube is changing how YouTube Shorts views are counted (March 2025)
- OverseerOS: What Is a Good YouTube Engagement Rate? Data From 2,251 Recent Videos (August 2026, updated October 2026)
- Violot, Elmas, Bilogrevic, Humbert: Shorts vs. Regular Videos on YouTube: A Comparative Analysis of User Engagement and Content Creation Trends (ACM Web Science 2024)
Frequently asked questions
What is a good engagement rate on YouTube in 2026?+
For long-form videos, about 3 to 4% is typical and around 5% is strong, using (likes + comments) ÷ views × 100. Shorts run a little lower, with a median near 2.7%. Anything above 7% puts a channel in roughly the top 10%.
How do you calculate YouTube engagement rate?+
Add a video's likes and comments, divide by its views, and multiply by 100. Average it across your last 10 to 20 uploads, and keep Shorts and long-form in separate averages because they behave differently.
What is a good click-through rate on YouTube?+
YouTube says half of all channels and videos have an impressions CTR between 2% and 10%. Where you land inside that range depends on where impressions come from: browse and suggested traffic to new viewers usually click less than your existing subscribers do.
Is a 2% engagement rate on YouTube bad?+
For long-form it sits near the bottom quarter of recent videos, so it is worth a look, but check click-through rate and retention first. A video with healthy CTR and retention and a 2% engagement rate is usually fine; it just isn't prompting reactions.
Does subscriber count affect YouTube engagement rate?+
Barely, for long-form. In a 2026 sample of 2,251 recent videos, median long-form engagement sat between 3.3% and 3.7% at every channel size, from under 10K subscribers to over 1M.
Chris is the founder and CEO of CaptureFlow, which he builds so founders can turn their expertise into content without hiring a team. After 10+ years building products and growing audiences from scratch, he writes about founder-led content, AI, and distribution from inside the problem he is solving: distributing consistent, on-brand content as a team of one.
Founder & CEO of CaptureFlow · 10+ years building products and audiences
One playbook a week from founders who actually create and distribute lots of content. No spam, unsubscribe anytime.
Keep reading

What Is a Good Instagram Engagement Rate in 2026?
You open Insights, see 0.9%, and have no idea if that is good. It depends on your follower count far more than any single benchmark admits. Here is the honest version.

What Is a Good Engagement Rate on LinkedIn? (2026)
Everyone quotes a different good LinkedIn engagement rate, and most of the numbers come from tools measuring their own customers. Here is a straighter answer.

Best Time to Post on TikTok in 2026 (Data-Backed)
TikTok is the one big platform where the weekend beats the workweek. Here is what the non-vendor data says about timing in 2026, and a 14-day test to find your own window.