What Is a Good Instagram Engagement Rate in 2026?
A good Instagram engagement rate depends on your size: roughly 2 to 4% under 25K followers, 1 to 2% above that. Here is how to read yours, and what to fix.

You open Instagram Insights, do the math, and land on 0.9%. Is that good? A good Instagram engagement rate in 2026 depends mostly on how many followers you have: roughly 2 to 4% is solid for accounts under 25K, and 1 to 2% is healthy once you pass 100K.
That's the short answer. The longer one matters more, because a single "good" number hides the thing that actually decides it: your size, your formula, and whether the benchmark you're comparing against measured anything like your account.
Instagram engagement rate is the share of your audience that interacts with a post: likes, comments, saves, and shares, divided by your follower count (or by reach), times 100.
How do you calculate your Instagram engagement rate?
The standard formula is engagement by followers:
(likes + comments + saves + shares) ÷ followers × 100
Run it on your last 10 to 20 feed posts and average the results. One post tells you about that post. Twenty tell you about your account.
There are two other versions you'll see, and mixing them up is the most common reason people panic over their numbers:
| Formula | Divide by | Use it to answer |
|---|---|---|
| By followers | Follower count | "How does my account compare to others my size?" |
| By reach | Accounts reached | "Did this post land with the people who saw it?" |
| By views | Total views | "How efficient was this piece of content?" (views count repeat plays) |
Reach-based rates always come out higher, because reach is almost always smaller than your follower count. And since Instagram made views the primary metric across Reels, Stories, photos, and carousels in August 2024, the number staring at you in the app is often not the one benchmark tables use. Instagram's own Help Center separates accounts reached from accounts engaged, and that distinction is the whole game.
If you'd rather skip the arithmetic, our free Instagram engagement calculator does it and places you in your follower tier.
What is a good Instagram engagement rate by follower count?
Here's the working guide we use in our engagement benchmarks tool. These are curated bands by followers, not a single study, so treat them as a sense check rather than a pass mark.
| Followers | Typical (median) | Good | Great |
|---|---|---|---|
| Under 5K | 2.2% | 4.0% | 6.5% |
| 5K to 25K | 1.6% | 2.8% | 4.5% |
| 25K to 100K | 1.1% | 2.0% | 3.2% |
| 100K to 500K | 0.9% | 1.6% | 2.6% |
| 500K+ | 0.7% | 1.3% | 2.1% |
Look at the shape, not just the cells. A 50K account at 1.5% isn't underperforming a 4K account at 3%. It's normal for its size.
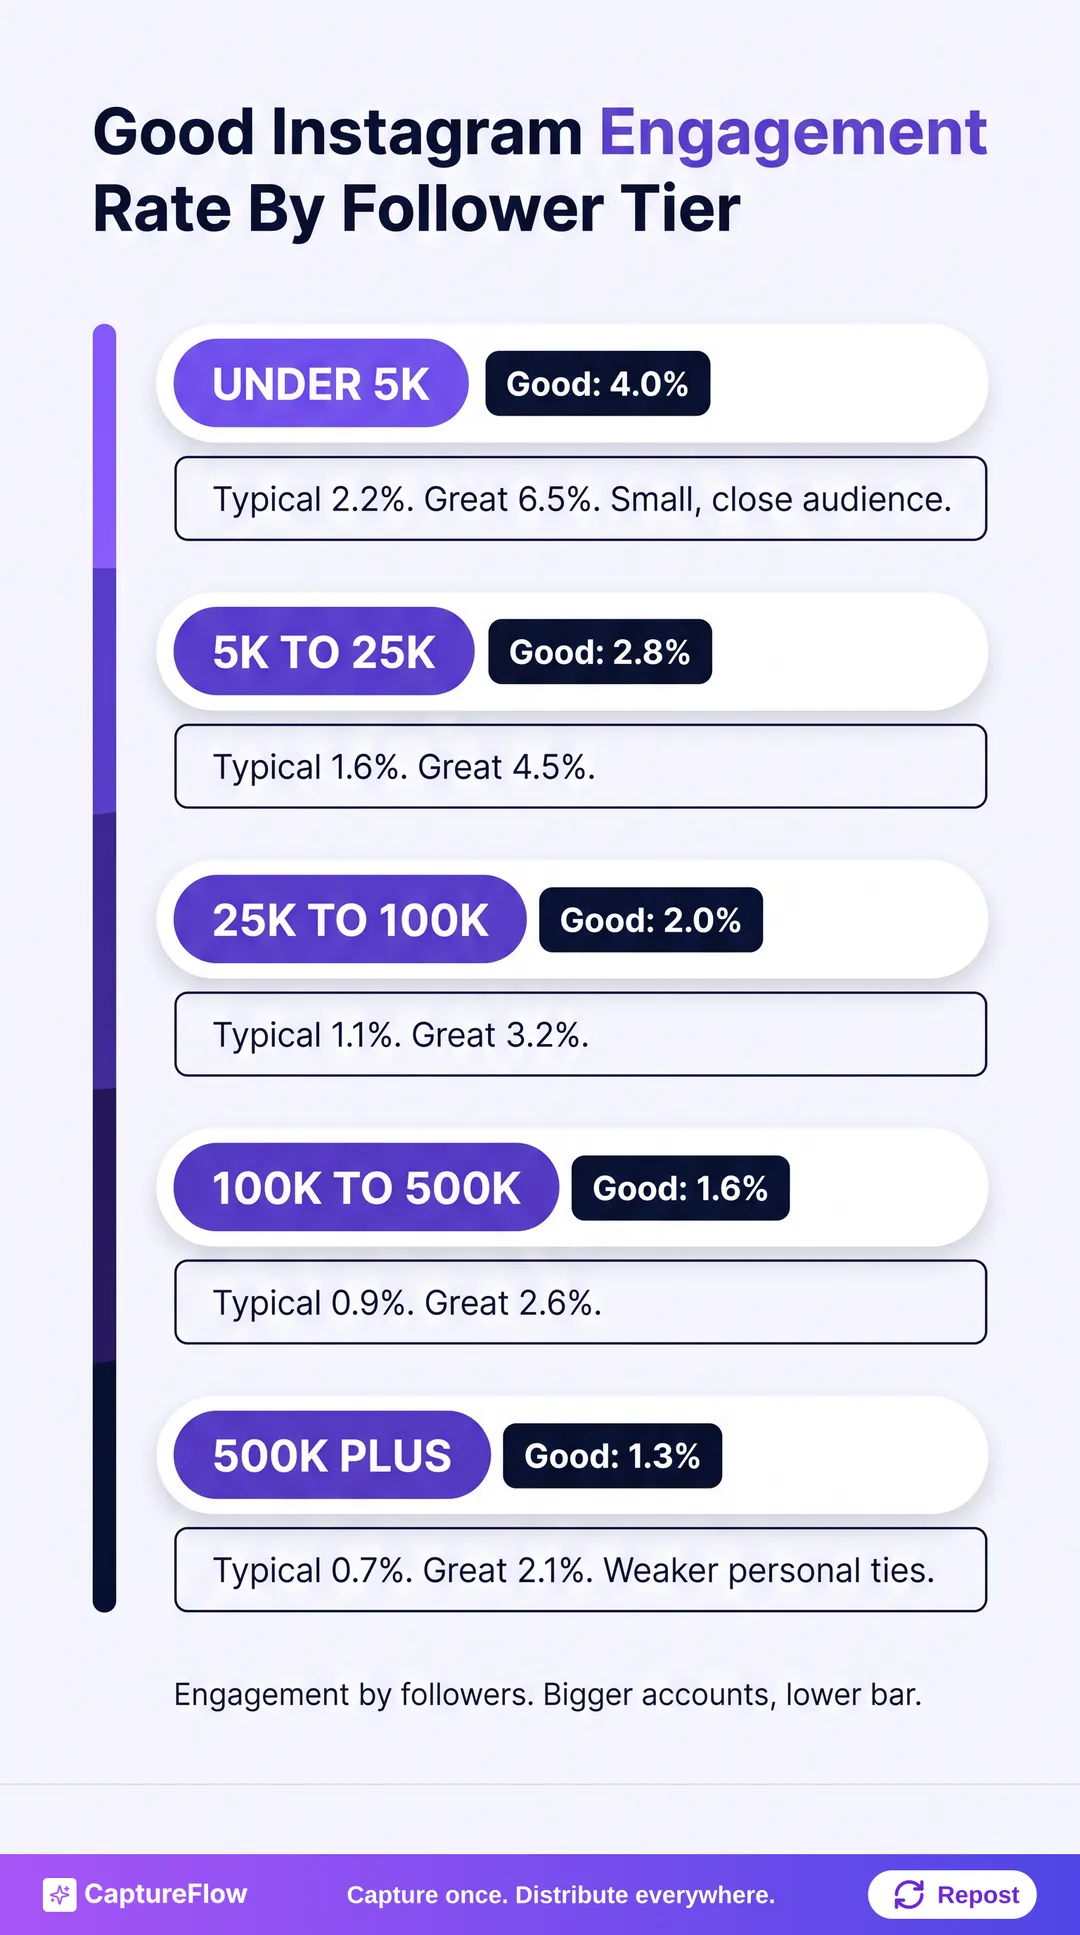 Good Instagram engagement rates by follower tier. The bigger the account, the lower the bar.
Why bigger accounts get lower rates
This one is backed by real research, not vibes. A Journal of Marketing study by Wies, Bleier, and Edeling analyzed more than 1,700 Instagram influencers across 800+ campaigns and found engagement follows an inverted U. It rises from tiny to mid-sized accounts, then falls as follower counts climb, because followers of huge accounts feel a weaker personal tie and are less motivated to engage.
That matches what you'd guess from the inside. At 3,000 followers, most people chose you on purpose. At 300,000, a big chunk arrived during one viral Reel and never came back.
Brand accounts sit lower again. People follow a coffee brand to see a discount once a quarter; they follow a creator to hear from a person. If you run a company account, crossing 1% per post is a fair target at almost any size.
Why do Instagram engagement benchmarks disagree so much?
Search this question and you'll find "1 to 3%," "0.5%," "4 to 6%," all stated with total confidence. They can't all be right for you. Three things cause the spread:
- Who was measured. Almost every widely quoted Instagram benchmark is published by a social analytics or scheduling vendor, calculated across its own customers. That's a self-selected slice of Instagram, usually skewed toward brands.
- Which denominator. A reach-based 4% and a follower-based 0.6% can describe the exact same post.
- Which accounts got averaged. Blend nano creators with million-follower brands and you get a number that fits nobody.
Only compare your rate to a benchmark built on the same formula and a similar account size. If a source doesn't say how it calculated engagement, ignore its number.
This is the same problem we found with LinkedIn engagement rate benchmarks: the numbers that travel furthest are the least comparable.
What does Instagram itself actually measure?
Here's the twist. Instagram doesn't rank your posts on "engagement rate" at all.
In January 2025, Adam Mosseri said the top three ranking signals are watch time, likes, and sends, and told creators to watch average watch time, likes per reach, and sends per reach in Insights. He added a detail most people skim past: likes matter slightly more for content shown to your followers, while sends (a share to someone's DMs) matter slightly more for content shown to people who don't follow you yet.
Instagram's official ranking explainer says much the same in longer form. For Reels, the system predicts whether you'll reshare, watch to the end, like, or tap through to the audio page. For Feed, it predicts whether you'll spend a few seconds on a post, comment, like, share, or tap the profile.
So "rate" is Instagram's word too. Just per reach, not per follower.
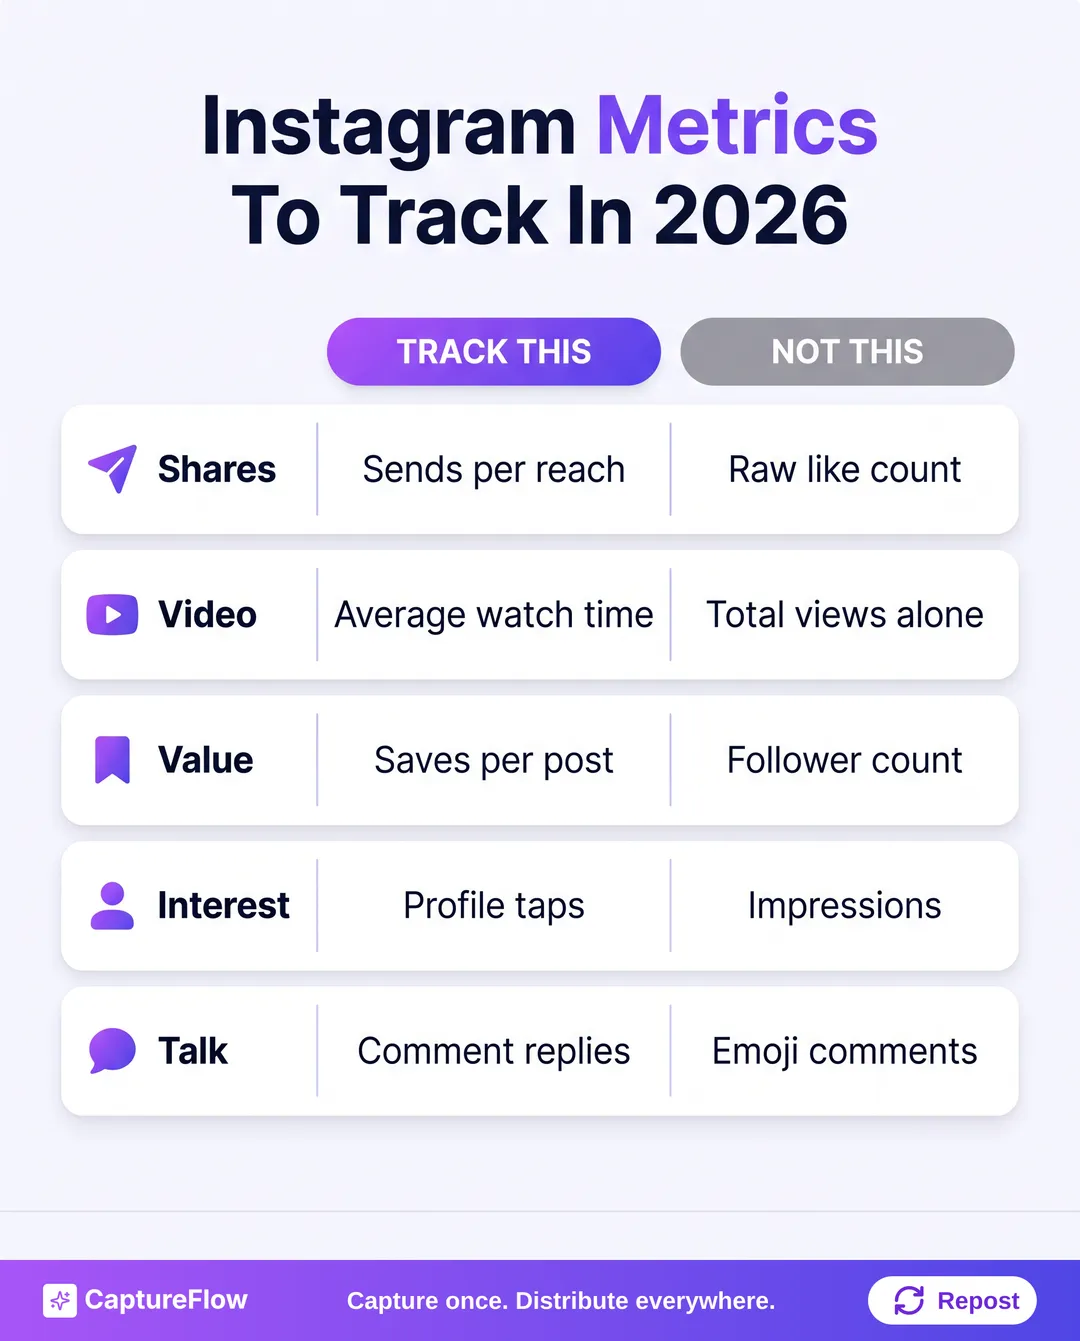 The signals Instagram ranks on, next to the vanity numbers they replace.
A post with 40 sends and 90 likes is doing more for your growth than one with 400 likes and no sends.
Do Reels or carousels get better engagement?
They do different jobs, and the best accounts use both.
Reels are built for discovery. They're the format Instagram puts in front of non-followers, which is exactly where sends carry the most weight. Use them when the goal is new people.
Carousels hold attention. Mosseri said in October 2024 that carousels usually get more reach than single photos, because more slides mean more interactions, and Instagram will often give an unswiped carousel a second chance by showing it again from slide two. Adding music makes photos and carousels eligible for the Reels tab, too.
Single static images are the format to lean on least. Not dead. Just outgunned by a carousel built from the same idea.
If you've been making carousels for LinkedIn, the same structure carries over almost untouched; our carousel guide covers the slide-by-slide build.
What should you do if your engagement rate is below benchmark?
A low number is a diagnosis, not a verdict. Work through it in this order:
- Split your rate by format. Average your last 20 posts per format. If carousels sit at 3% and single images at 0.6%, you don't have a content problem. You have a format mix problem.
- Check your denominator. A giveaway, a viral Reel, or an old follower purchase inflates followers without adding interest. Your rate can drop while your content gets better.
- Design for sends and saves. Checklists, frameworks, and "send this to the friend who..." posts earn the actions Instagram weighs most. A pretty photo earns a tap of the heart.
- Hook in the first second. Watch time is a top signal, so the first frame of a Reel and the first slide of a carousel do most of the work.
- Reply in the first hour. Real back-and-forth in comments is engagement in its own right and tells the system people are talking.
- Post consistently, not constantly. More filler posts drag your average down. Our guide on how often to post on social media has the cadence math.
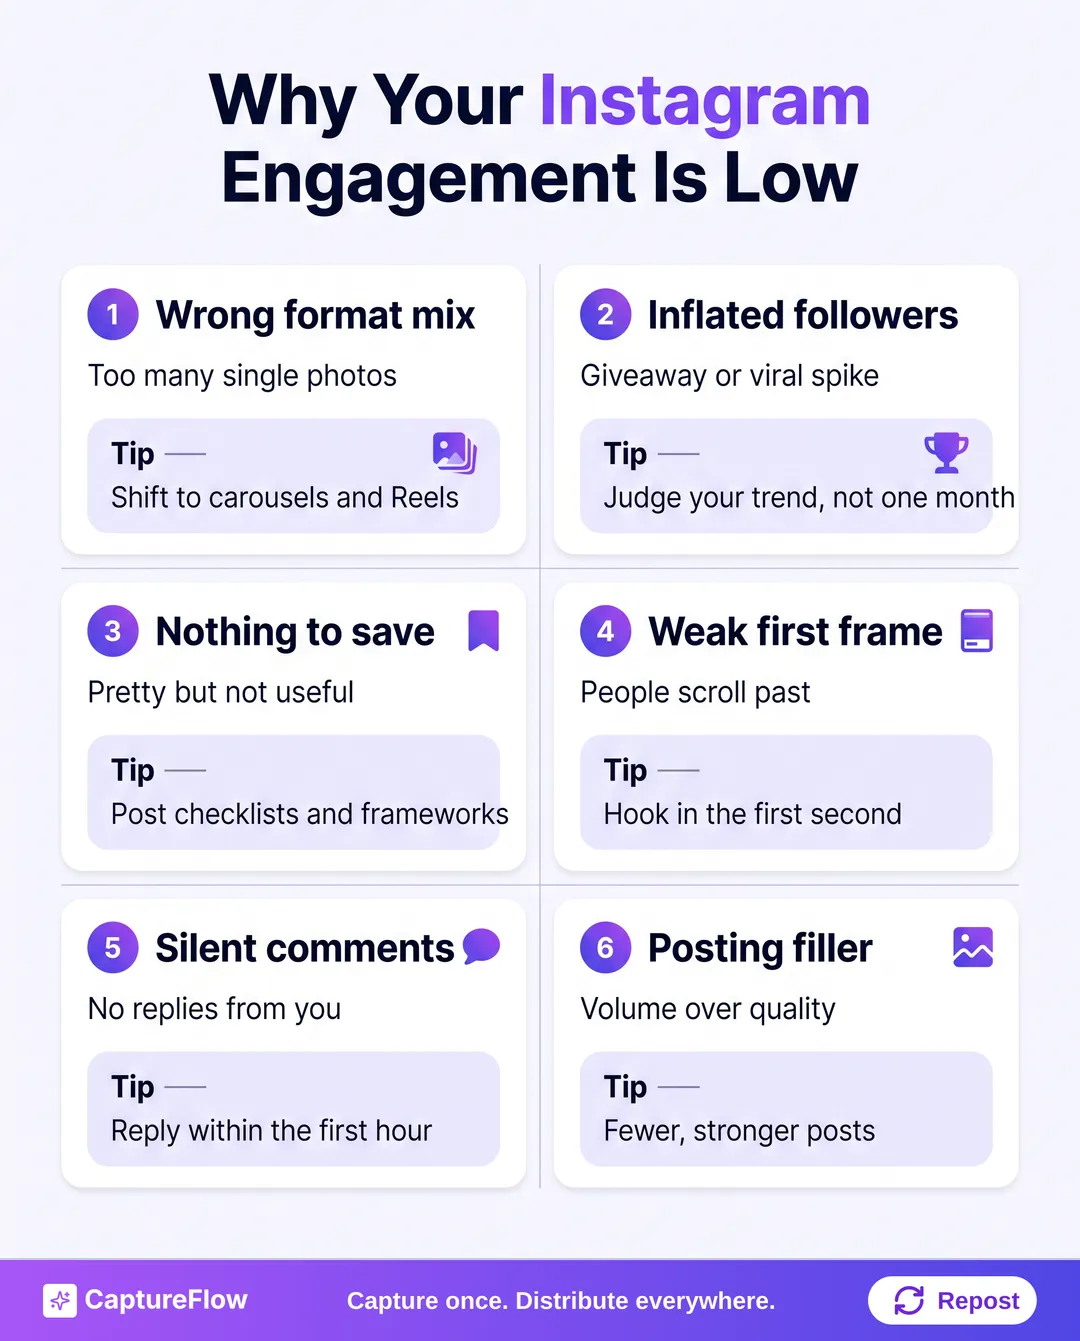 Six reasons your Instagram engagement rate is low, and the fix for each.
Instagram keeps getting more crowded (it passed 3 billion monthly users in September 2025), so every post competes with more content than last year. If your rate holds steady through that, you're winning. Track your own trend before anyone's benchmark.
The real bottleneck: enough good posts to test
Every fix above needs volume. You can't tell whether carousels beat single images for your audience from three posts. You need a steady stream of Reels and carousels built from ideas you actually have.
That's the gap we built CaptureFlow for. CaptureFlow is an AI content agent that turns your expertise into weeks of on-brand content for every platform. You capture one idea in about 5 minutes (a voice note, a video, a file, or a link), and the agent, trained on your voice and past posts, reshapes it into native formats for each channel: an Instagram carousel, a short video, quote images, plus LinkedIn and X posts from the same idea. Then it schedules them so you can test formats against each other for weeks, not days.
Want to see where you stand first? Run your handle through the free Instagram analyzer. Ready to fix the volume problem? See the plans.
Sources
- Journal of Marketing: Finding Goldilocks Influencers: How Follower Count Drives Social Media Engagement (Wies, Bleier, Edeling, 2023)
- American Marketing Association: Why high follower count may not be the best driver of engagement
- Social Media Today: Instagram shares algorithm insights for 2025
- Instagram: Instagram Ranking Explained
- Instagram Help Center: Insights metrics for posts, reels, and stories
- Tubefilter: Instagram standardizes its metrics around views
- RouteNote: Instagram carousels perform better than single photos, according to the head of Instagram
- Reuters via The Star: Instagram has grown to 3 billion monthly active users
Frequently asked questions
What is a good engagement rate on Instagram in 2026?+
It depends on your follower count. As a working guide, 2 to 4% by followers is good for accounts under 25K, around 2% is good from 25K to 100K, and 1.3 to 1.6% is good above 100K. Brand accounts usually run lower than creators at every size.
How do I calculate my Instagram engagement rate?+
Add a post's likes, comments, saves, and shares, divide by your follower count, and multiply by 100. Average it over your last 10 to 20 posts. Divide by reach instead if you want to know how well a post landed with the people who actually saw it.
Is a 1% engagement rate on Instagram good?+
For an account with 100K+ followers or a brand account, 1% is around normal to solid. For a creator under 10K followers, 1% is low, because small accounts typically run two to four times higher.
Why is my Instagram engagement rate going down?+
The usual causes are follower growth outpacing genuine interest (after a viral post or giveaway), leaning on single static images, or posting more often with weaker posts. Check your rate per format and per post before changing everything at once.
Chris is the founder and CEO of CaptureFlow, which he builds so founders can turn their expertise into content without hiring a team. After 10+ years building products and growing audiences from scratch, he writes about founder-led content, AI, and distribution from inside the problem he is solving: distributing consistent, on-brand content as a team of one.
Founder & CEO of CaptureFlow · 10+ years building products and audiences
One playbook a week from founders who actually create and distribute lots of content. No spam, unsubscribe anytime.
Keep reading
What Is a Good Engagement Rate on LinkedIn? (2026)
Everyone quotes a different good LinkedIn engagement rate, and most of the numbers come from tools measuring their own customers. Here is a straighter answer.

Employee Advocacy Tools vs Letting Employees Post on Their Own
Do you need an employee advocacy platform, or is letting employees post on their own better? The honest answer depends on your size, and mostly on adoption.

7 Best Content Workflow Tools for Agencies in 2026
Managing content for a dozen B2B clients is a coordination problem before it is a posting problem. Here are the 7 tools that actually hold the workflow together, ranked.